
"Education-Instruction-Inspiration"
Name of Section:
BB Assistant Director-2013
Based on the graph answer:
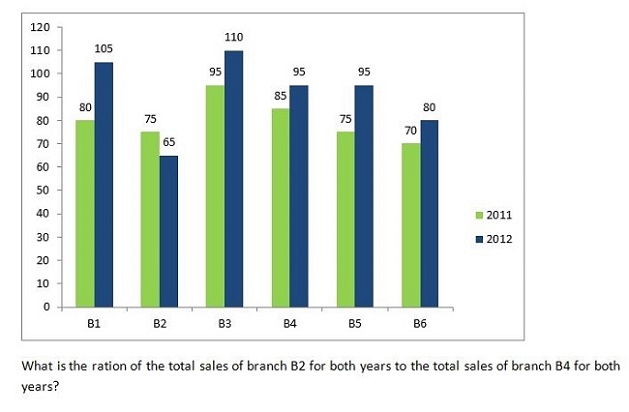
The bar graph given below shows the sales of books (in thousands) from six branches(B1, B2, B3, B4, B5, B6) of a publishing company during two consecutive years 2011 and 2012.
Answer
99.
What is the average sales of all the branches (in thousands) for the year 2011?
[BB Assistant Director-2013 : 2013]
Answer